Right, so I think I've learned a bit more (and been a bit more careful in testing).
It's not actually a case of hxcfe vs hxcfloppyemulator -- it's a case of both not being able to correctly overlay the colored track visualizsation on raw flux dumps from IBM MFM 2.88 disks.
Here is the overlay working correctly on both a 1.44 raw dump (top) and the img file generated from it (bottom):
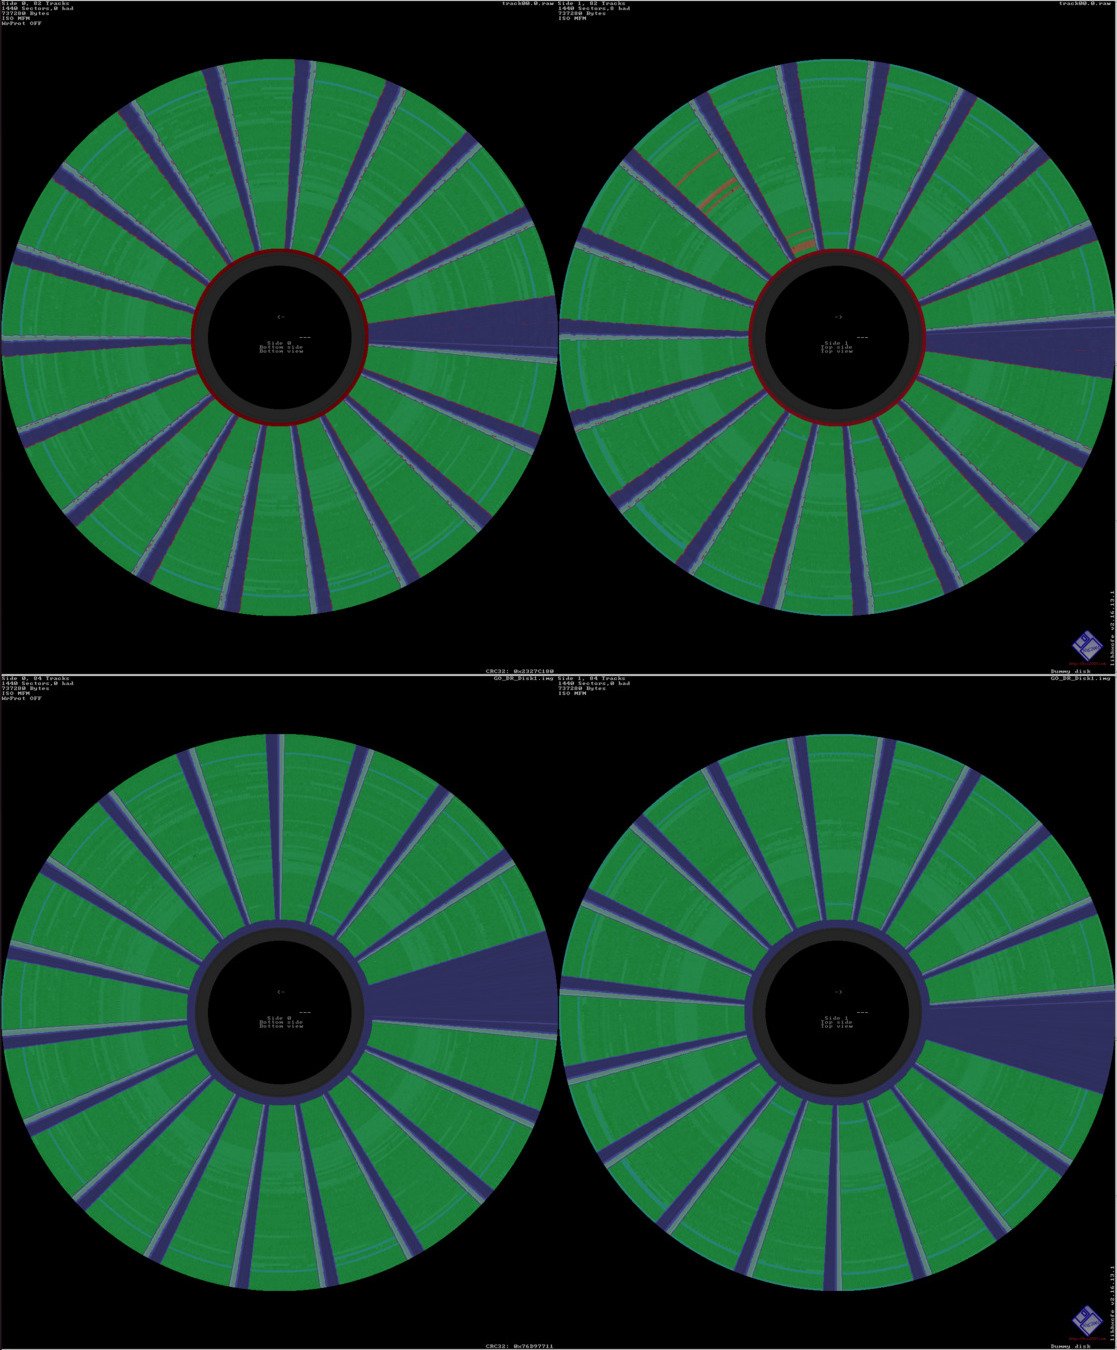
- 144out.jpg (221.93 KiB) Viewed 24674 times
Here is the overlay failing to generate on a 2.88 raw dump (top) but working on the img file generated from it (bottom)
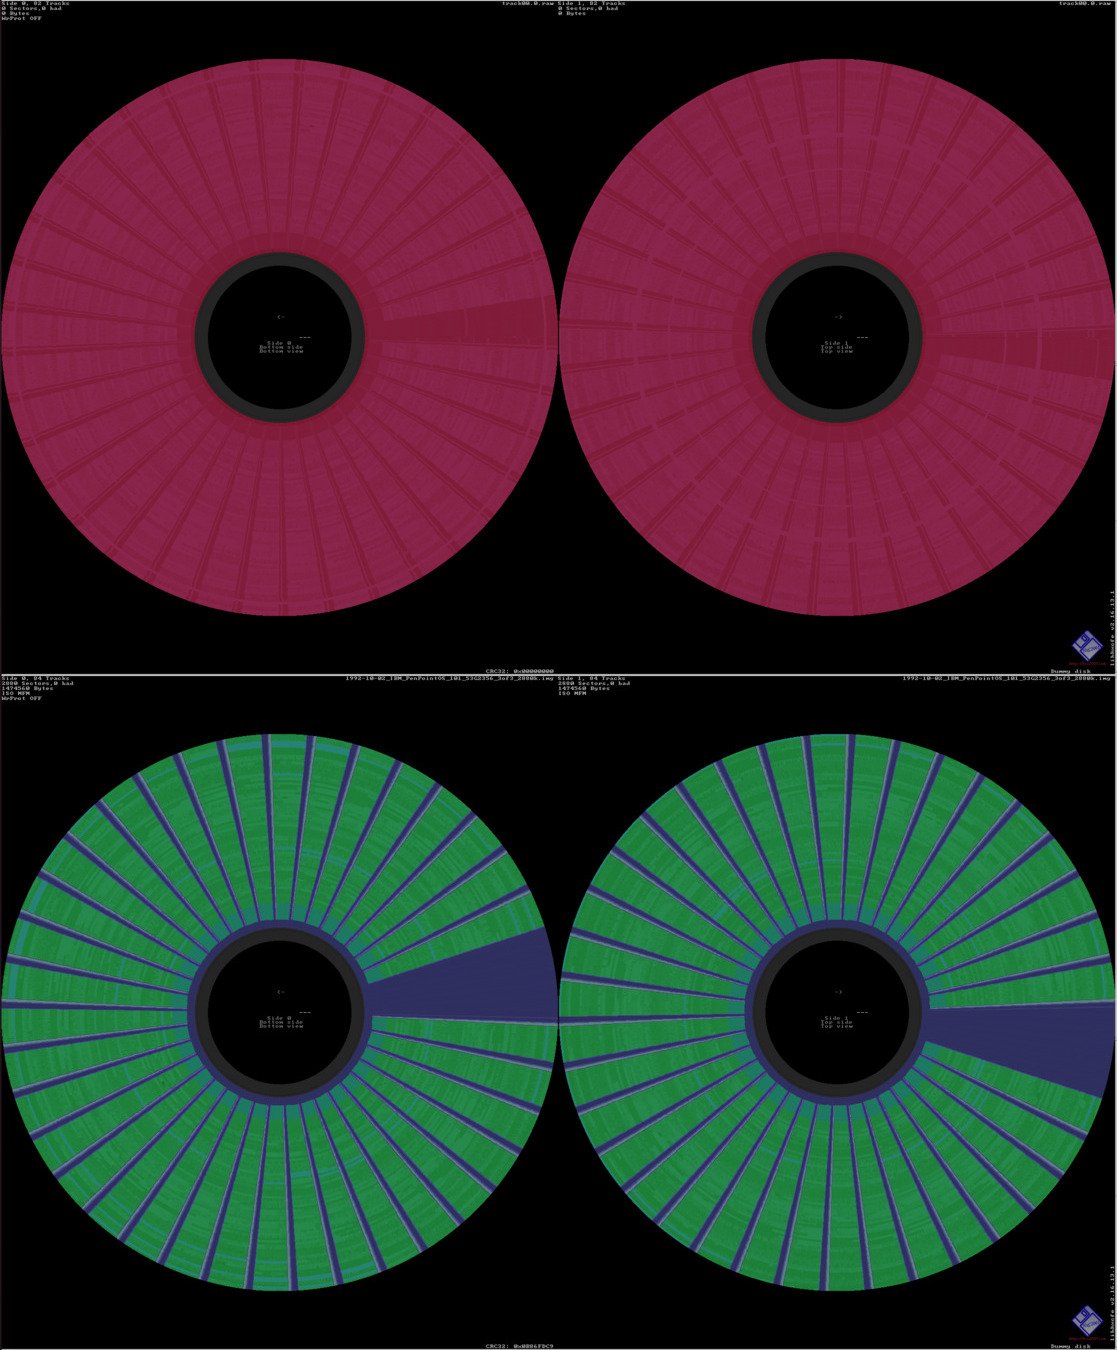
- 288out.jpg (202.4 KiB) Viewed 24674 times
I wonder if there's any parameter I can modfiy to adjust the sensitivity? Or perhaps it's a mismatch between what the program thinks an ED floppy is and what I have? (These are 'official' IBM ED disks...)
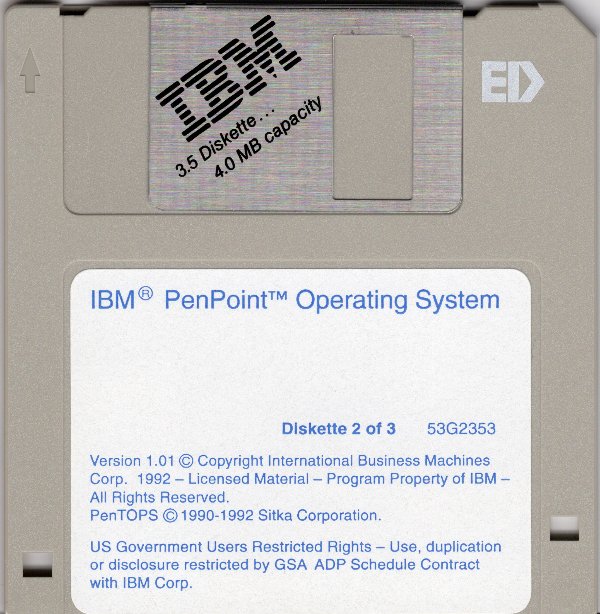
- 1992-10-01_IBM_PenPointOS_101_53G2353_2of3_2880k.jpg (85.73 KiB) Viewed 24674 times